OVERVIEW
The Weekend Rip: April 13, 2025

Source: Tenor
It was a wild week in markets. Stocks recouped some of their recent losses, but volatility and uncertainty continued. Thank goodness it’s a four-day week ahead. 😵💫
Let's recap and prep you for the shortened week ahead. 📝
What Happened?
😱 On Monday, stocks experienced a “Black Monday” bounce after initially falling over 6% across the board. Rumors of a 90-day tariff pause sent stocks soaring before the White House called it “fake news.” Plus, there’s always a bull market somewhere, as Janover Inc. soared on its crypto pivot.
😐 On Tuesday, the VIX closed at a five-year high after an initial rally failed to hold. Concerns from businesses, political leaders, and significant investors continued to drive market volatility. Insurance companies caught a bid on the latest Medicare payment news, and marijuana stocks were smoked to new lows.
📈 On Wednesday, stocks had a $4 trillion day after President Trump tweeted that he would pause tariffs on nearly every country with a rate over 10%. Before doing that, he tweeted “This is a great time to buy,” drawing scrutiny about his use of social media to communicate policy decisions. Plus, companies like Walmart and Delta began to pull forward guidance, and healthcare stocks braced for pharmaceutical tariffs.
🐻 On Thursday, the market gave back roughly $2 trillion of its gains as the U.S. Dollar Index and treasury bonds sold off sharply. On a positive note, consumer prices fell MoM in March, helping to renew hopes that a Fed rate cut could be coming sooner rather than later.
🥵 On Friday, stocks closed the week out in the green as big banks kicked off earnings season. Gold hit new all-time highs, the Dollar Index fell to three-year lows, and the University of Michigan’s consumer sentiment survey highlighted a new level of negativity. Apple was among the leading stocks as traders bet on weekend news.
🤩 This week's Stocktwits Top 25 showed underperformance vs. the major indexes.
Here are the closing prices:
S&P 500 | 5,363 | +5.70% |
Nasdaq | 16,725 | +7.29% |
Russell 2000 | 1,860 | +1.81% |
Dow Jones | 40,213 | +4.95% |
STOCKS
Introducing The “Stocktwits Sentiment Index” 👀
We all know the traditional CBOE Volatility Index ($VIX), which is typically used as a fear/greed measure on Wall Street. It represents the annualized implied volatility of an S&P 500 stock option with 30 days to expiration, or in other words, it defines the market’s expectation for how volatile the market will be over the next month. 📆
The higher the volatility index, the larger the expected swings in the market.
On a day-to-day basis, traders use it to estimate the expected daily percentage move in the S&P 500 by dividing the value by 16. Currently at 37, the market is pricing in a 2.31% daily move. Earlier in the week, when it reached 60, a 3.75% daily move was expected. 🤯

Source: TradingView
This is a market-derived version of expectations, but what if there was a way to measure sentiment among retail investors and traders in real time based on what they’re talking about? Introducing the Stocktwits Sentiment Index. 🤩
The chart below shows this data that we’ve begun to tease, calculated using the previous week's bullish vs. bearish messages on the Stocktwits platform. And as we can see, it made a new high last week alongside the CBOE’s VIX. 😨
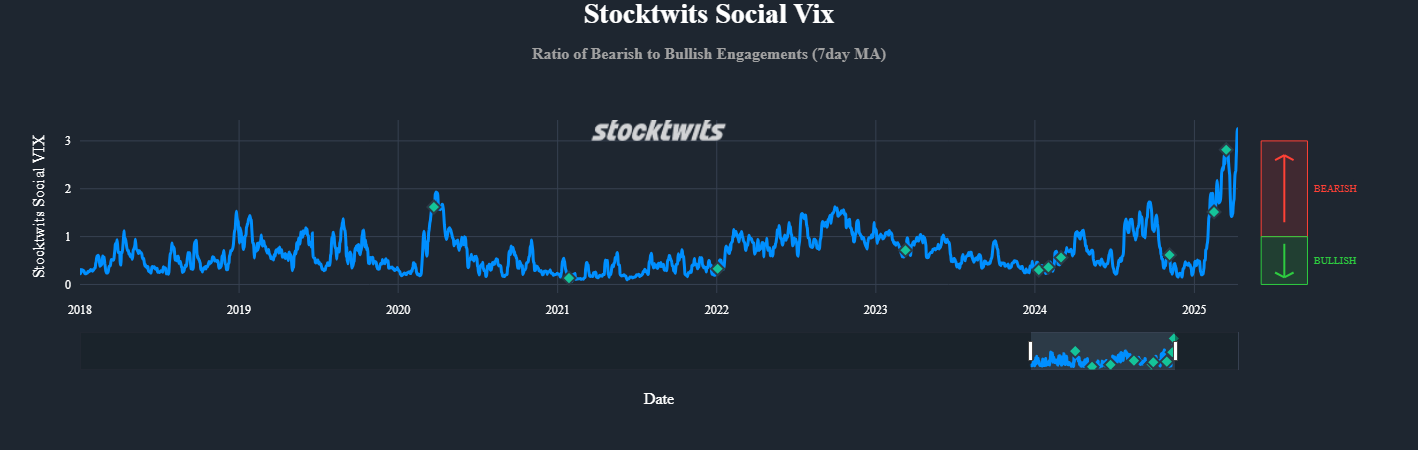
However, we can see this data's real value when we zoom in to a six-month view. The Stocktwits Sentiment Index began to tick higher in late January, a month before the CBOE Volatility Index started to increase. In other words, retail investors and traders were sniffing out trouble before the broader market did. 🧐

What’s the reasoning for this? As a market technician/analyst and Stocktwits user for the last decade, I have a theory. Stocktwits users are active traders and investors, typically buying/selling individual stocks. As a market technician, I know that market tops and bottoms are processes, not points, with individual stocks (or market breadth) diverging from index performance before major turns. 🕵
So, if individual stocks tend to lead the indexes and Stocktwits users are trading individual stocks, they’ll see the carnage (or opportunity) ahead before the indexes break down (or out). And based on this recent pullback, that seems plausible.
Many of the market’s most popular stocks either stalled or broke down in January and continued into February. So, Stocktwits users turned progressively more bearish. Eventually, when enough of them were falling, the major indexes began to take notice and start falling too. 📉
So the question now is, are Stocktwits users spotting opportunities yet? Based on last week’s data, the community is still skeptical of the market’s rebound as the Stocktwits Sentiment Index hit a new high along with the CBOE’s VIX.
What may indicate an improvement is something called a “divergence.” Traders and analysts look for instances where the market makes fresh lows, but the Stocktwits Sentiment Index makes a higher low, signaling improving sentiment even as prices drop. And vice versa when spotting market tops. 🔍
I joined “Trends With Friends” last week to discuss the Stocktwits Sentiment Index with Stocktwits co-founder and CEO Howard Lindzon and his friends Phil Pearlman and Michael Parekh. We touched on it at the 18:00 minute mark and will provide an update on this week’s episode, so tune in on Tuesday at 11:00 a.m. ET. 📺
Until we integrate this data into the Stocktwits site/app, we’ll post an updated version from the Stocktwits Handle each day after the close. We’ll pin it to the $VX_F stream so you can stay updated on its development.
In the meantime, let me know what you think of this data and my theory above! 🧠
IN PARTNERSHIP WITH STOCKTWITS
Expert Charts, Candor, & Conclusions: Join Us Monday, April 14th In NYC 🧑🏫

Fundstrat’s Mark Newton & Tom Lee will join Macro Risk Advisors’ John Kolovos for a session, “Navigating the Noise: Tools & Tactics in Turbulent Markets.” 🚨
Join the CMT Association for this must-attend event for financial professionals seeking cutting-edge insights into technical analysis, market strategy, and next-gen portfolio management. Taking place at the stunning Hudson Yards, this summit promises to deliver valuable knowledge from industry leaders and thought-provoking discussions.
Kick off the Summit with networking and refreshments, then dive into an afternoon filled with engaging sessions. Learn to develop a tactical playbook for volatile, uncertain, and erratic markets from a panel of seasoned experts, including Jay Woods, CMT; Frank Cappelleri, CMT, CFA; and Katie Stockton, CMT.
Wrap up the summit by connecting with peers during a relaxed cocktail hour. Don’t miss this unique opportunity to advance your technical analysis expertise and expand your professional network. Stocktwits’ own Tom Bruni and Kevin Travers will be in attendance, so we’ll see you there! 👋
*3rd Party Ad. Not an offer or recommendation by Stocktwits. See disclosure here.
THE BRIEF
Need a concise summary of what's going on this week? Look no further. Here’s a rundown of this week’s earnings and economic data.
Economic Calendar

Source: TradingEconomics
It’s a quiet week of economic data, with investors focused on inflation data and Fed member speeches. In addition to the above, check out this week's complete list of economic releases.
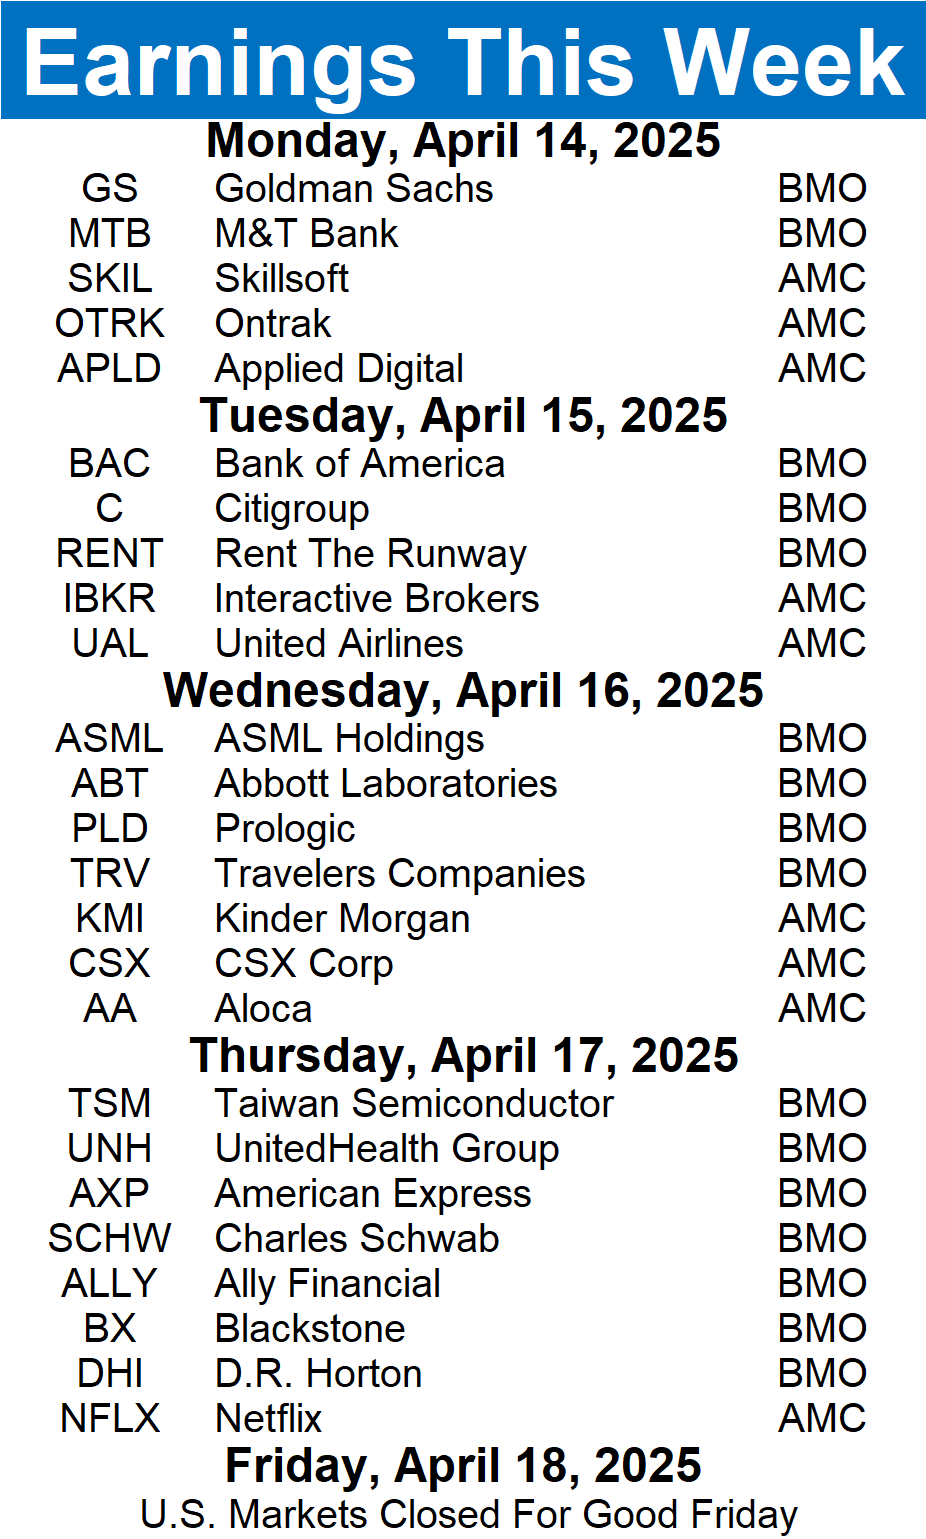
Earnings This Week
Earnings season is ramping up, with 89 companies reporting this week.
Source: Stocktwits
Above is a quick summary. Check out the full Stocktwits earnings calendar for the other names reporting this week.
Links That Don’t Suck 🌐
📦 Exclusive: Chinese suppliers are offering U.S. Amazon sellers a tariff solution—but it’s not legal
*3rd Party Ad. Not an offer or recommendation by Stocktwits. See disclosure here.
Get In Touch 📬
Follow our social channels for great, real-time content on Stocktwits and Twitter. And check out our YouTube channel for in-depth video content! 📲
Help us deliver the best content possible by completing this brief survey. 📝
Email me (Tom Bruni) your feedback; I’d love to hear from you. 📧
Want to sponsor this newsletter and reach hundreds of thousands of passionate investors and traders? Reach us here. 👍
Terms & Conditions 📝
Securities Disclaimer: STOCKTWITS IS NOT A TAX ADVISOR, BROKER, FINANCIAL ADVISOR OR INVESTMENT ADVISOR. THE SERVICE IS NOT INTENDED TO PROVIDE TAX, LEGAL, FINANCIAL OR INVESTMENT ADVICE, AND NOTHING ON THE SERVICE SHOULD BE CONSTRUED AS AN OFFER TO SELL, A SOLICITATION OF AN OFFER TO BUY, OR A RECOMMENDATION FOR ANY SECURITY. Trading in such securities can result in immediate and substantial losses of the capital invested. You should only invest risk capital, and not capital required for other purposes. You alone are solely responsible for determining whether any investment, security or strategy, or any other product or service, is appropriate or suitable for you based on your investment objectives and personal and financial situation. You should also consult an attorney or tax professional regarding your specific legal or tax situation. The Content is to be used for informational and entertainment purposes only and the Service does not provide investment advice for any individual. Stocktwits, its affiliates and partners specifically disclaim any and all liability or loss arising out of any action taken in reliance on Content, including but not limited to market value or other loss on the sale or purchase of any company, property, product, service, security, instrument, or any other matter. You understand that an investment in any security is subject to a number of risks, and that discussions of any security published on the Service will not contain a list or description of relevant risk factors. In addition, please note that some of the stocks about which Content is published on the Service have a low market capitalization and/or insufficient public float. Such stocks are subject to more risk than stocks of larger companies, including greater volatility, lower liquidity and less publicly available information. Read the full terms & conditions here. 🔍
Author Disclosure: The author of this newsletter does not hold positions in any of the securities or assets mentioned. 📋
